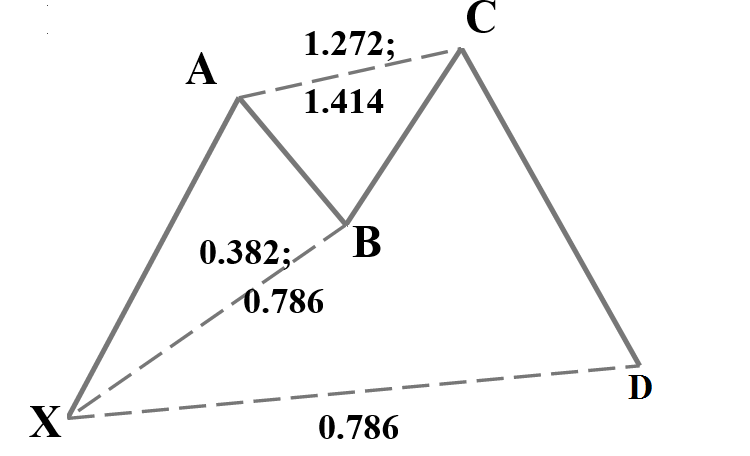
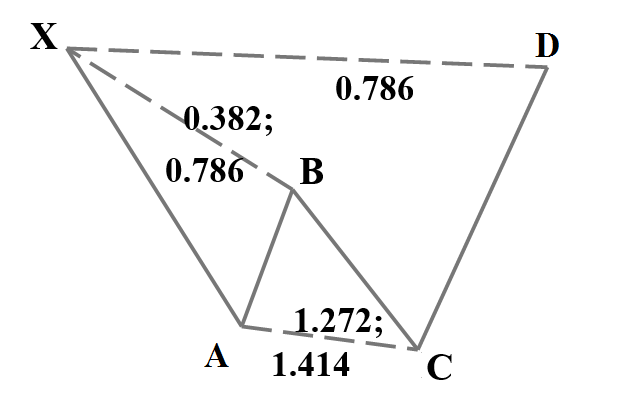
Cypher shows up very often on the chart. It also has less rule to follow compared to other harmonic patterns. Although the successful rate of this pattern has nothing special compared to Bat or Gartley, the frequency of showing up and the ease of rules make this pattern become the favorite for all newbie traders. In our experience, this pattern works best when the market is calm. In a strong trending market, especially after the news, Cypher pattern becomes less reliable. The bigger the pattern (the longer it takes to form the pattern), the stronger the support/resistance it provides. Rules: B point at less than 0.886 retracement of XA. C point needs to be in the range of XA projection. The price must at least touch the 1.272 XA projection but NOT CLOSE above 1.414 XA Projection. It’s the projection of XA and NOT AB. D point at 0.786 retracement of XC There is only 1 element forming the PRZ of Cypher pattern – 0.786 retracement of XC (not XA)
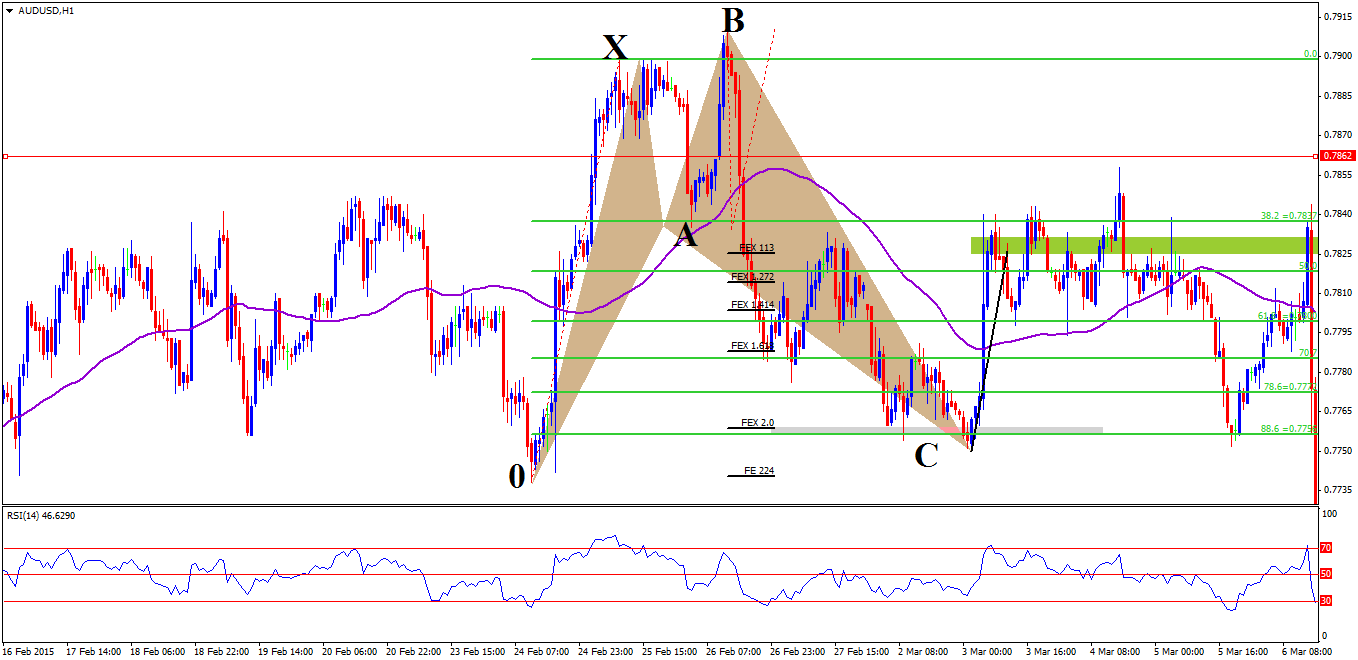
1. Bullish Cypher pattern
Examples: Figure 1 C point did close above 1.414 XA projection slightly. However the price immediately closes back below 1.414 Projection. With our experience through observing hundreds of Cypher pattern, a little subjective interpretation at C point can be allowed. Indeed, the price comes right in 0.786 XC retracement and reverse. Figure 2 Figure 2 provides a standard Cypher. C point is right at 1.272 XA projection. D point pinpoints a temporary support at 0.786 retracement of XC. With Cypher pattern, when price already reverse, stop loss should be moved to at least break-even as Cypher pattern usually doesn’t allow for a second test the 0.786 retracement level.
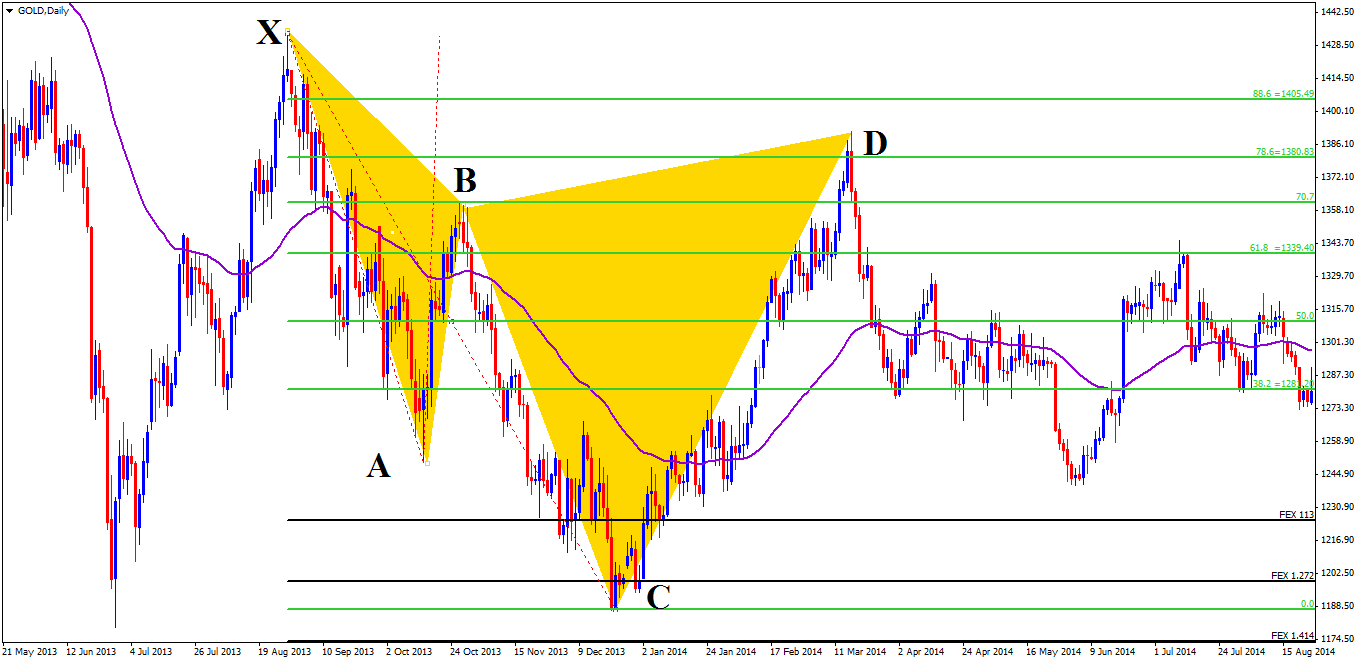
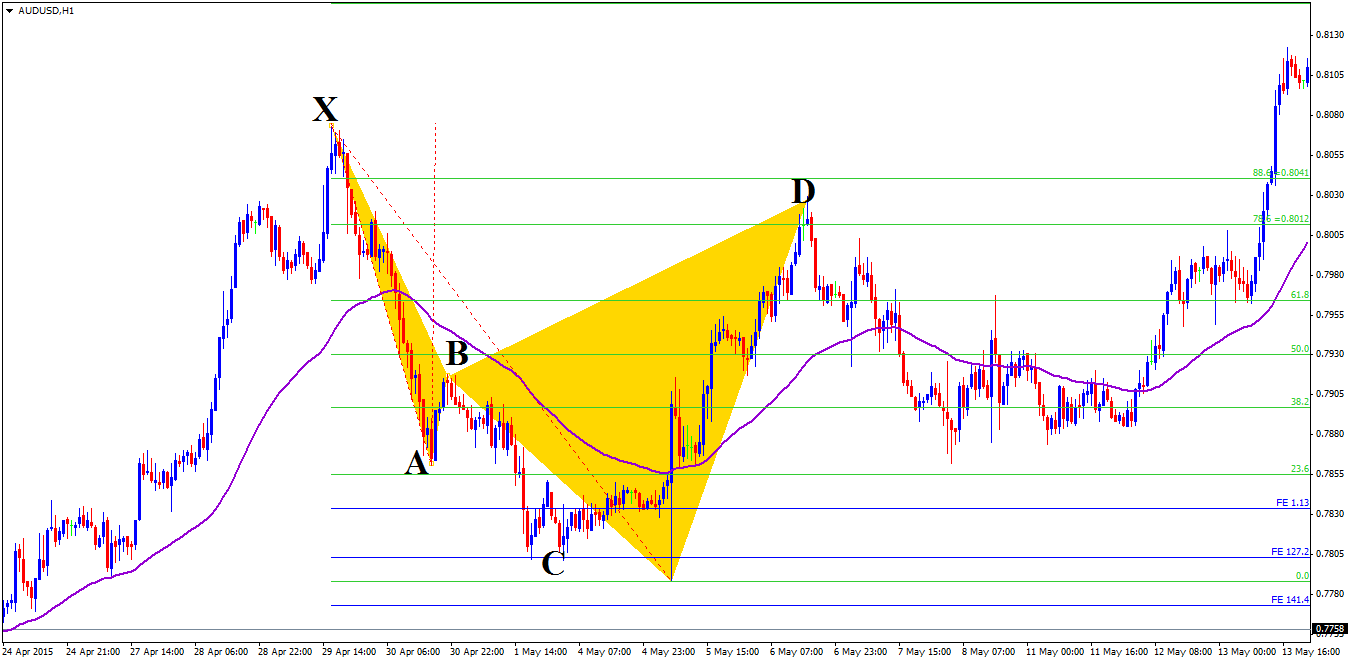
2. Bearish Cypher pattern
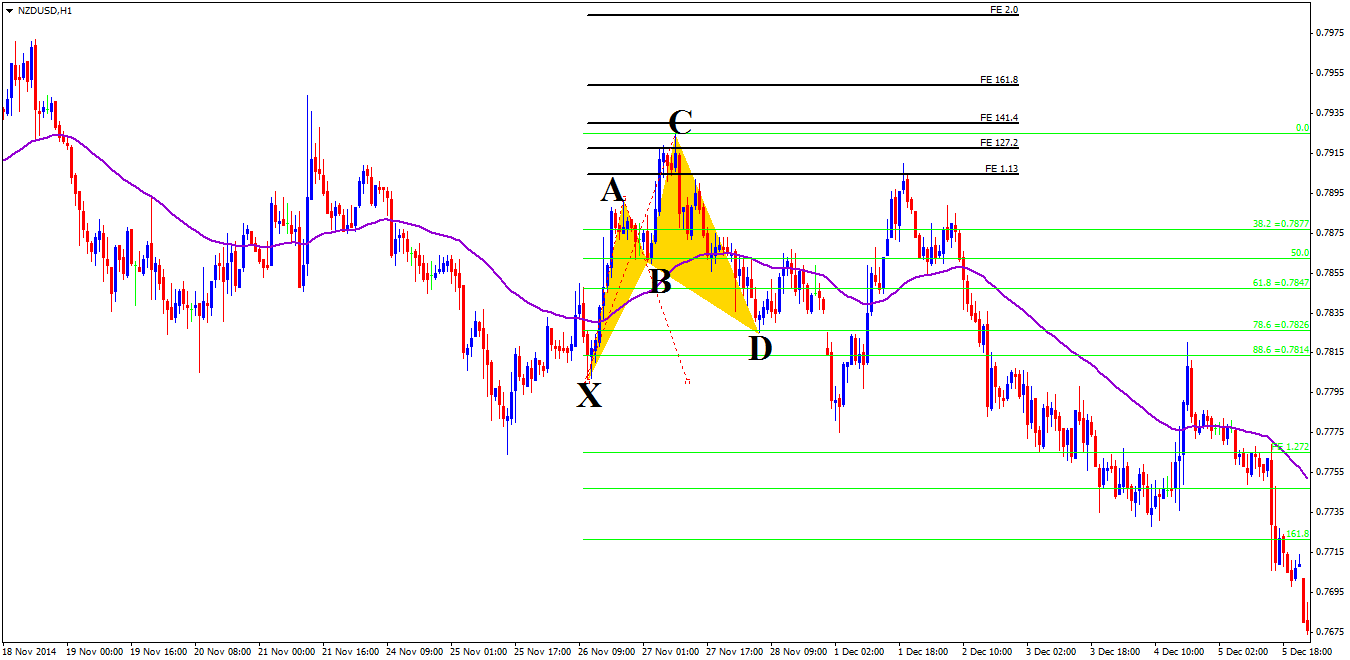
Examples: Figure 3 Figure 3 is a Cypher pattern on Gold daily chart. This pattern is super powerful as it is very “big”, which takes 7 months to complete the pattern. The price comes into 0.786 XC retracement and get rejected decisively. Again, the bigger the pattern, the stronger the support/resistance. In this example, C point is at 1.272 XA projection. B point is obviously valid so we don’t need to check. Figure 4 Figure 4 represents a standard Cypher pattern. C point is at 1.272 XA projection and D point reverse at 0.786 XC level. The stop loss level should be put right above point X as we need to leave room for the price to “breath” before the reversal takes place. Generally, it is easy to spot Cypher pattern on the chart. However, execution and take profit are the most critical factors in successful trading Cypher pattern. We will cover these skills later. This article is reserved to introduce and help new traders identify pattern in the market.
 Examples:
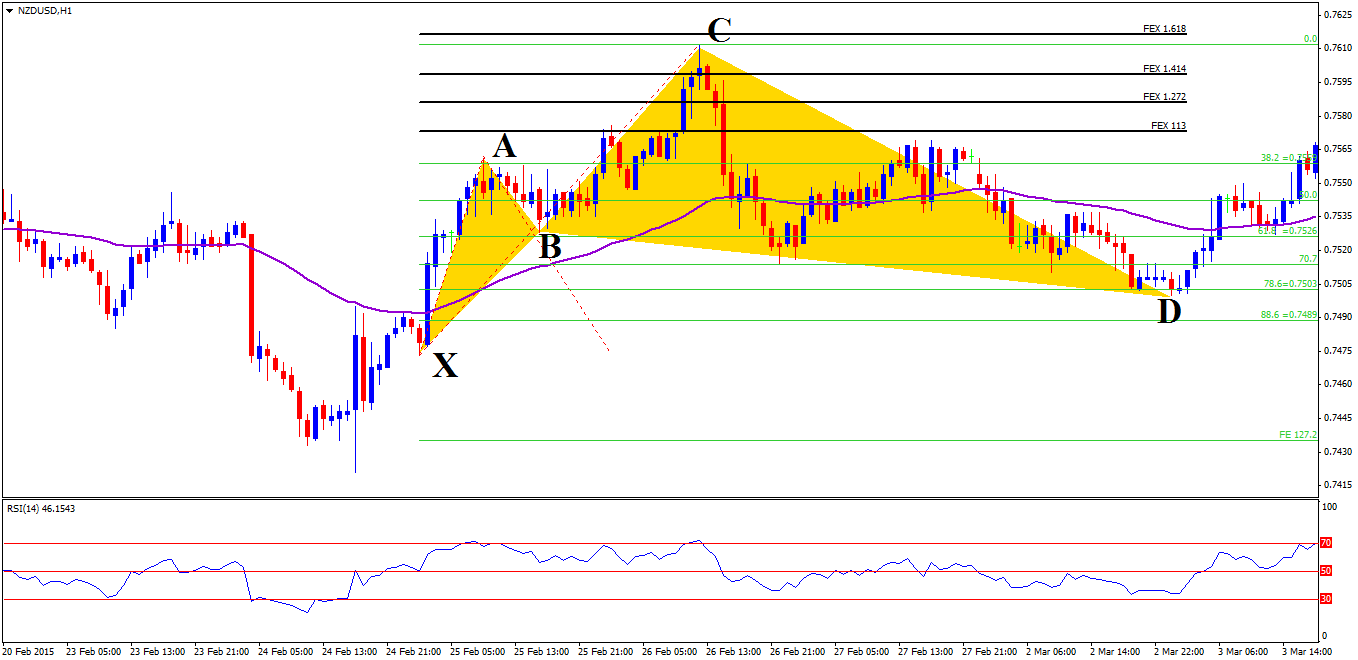
 Examples: