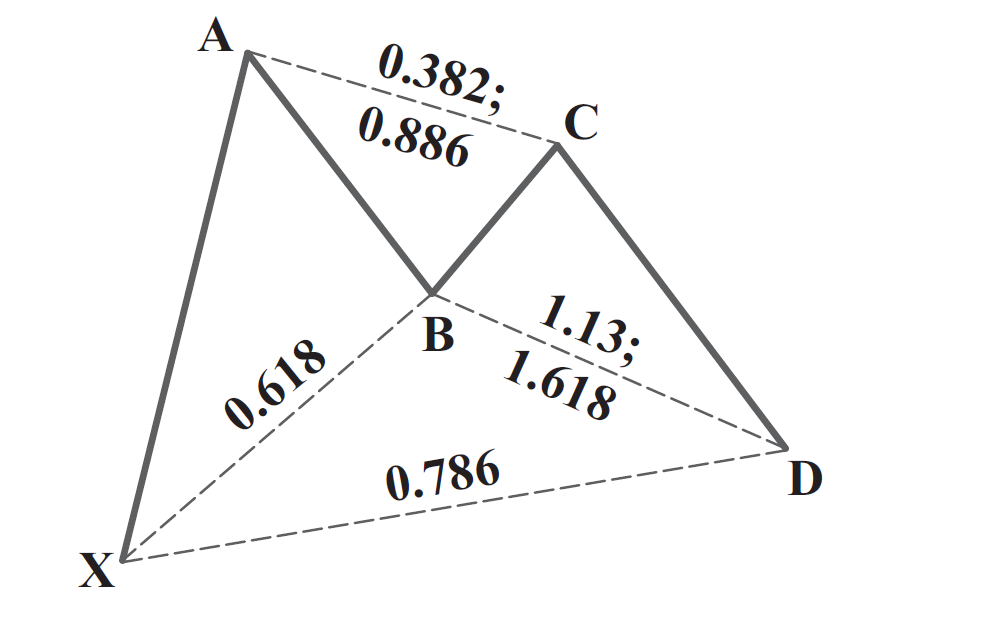
Gartley pattern possesses a very similar look as the Bat. However the ratio alignment is different. Rules: • Precise 61.8% B point retracement of XA leg. • BC projection must not exceed 1.618. • Equivalent AB=CD pattern (most critical) • 0.786 XA retracement. • C point within range of 0.382–0.886 retracement. 3 elements define the PRZ:
0.786 XA retracement
BC projection
AB=CD ( the most important)
As with all harmonic patterns, the specification of Fibonacci points within each structure is extremely critical in determining valid trading opportunities. All the rules need to be followed strictly !
1. Bullish gartley pattern
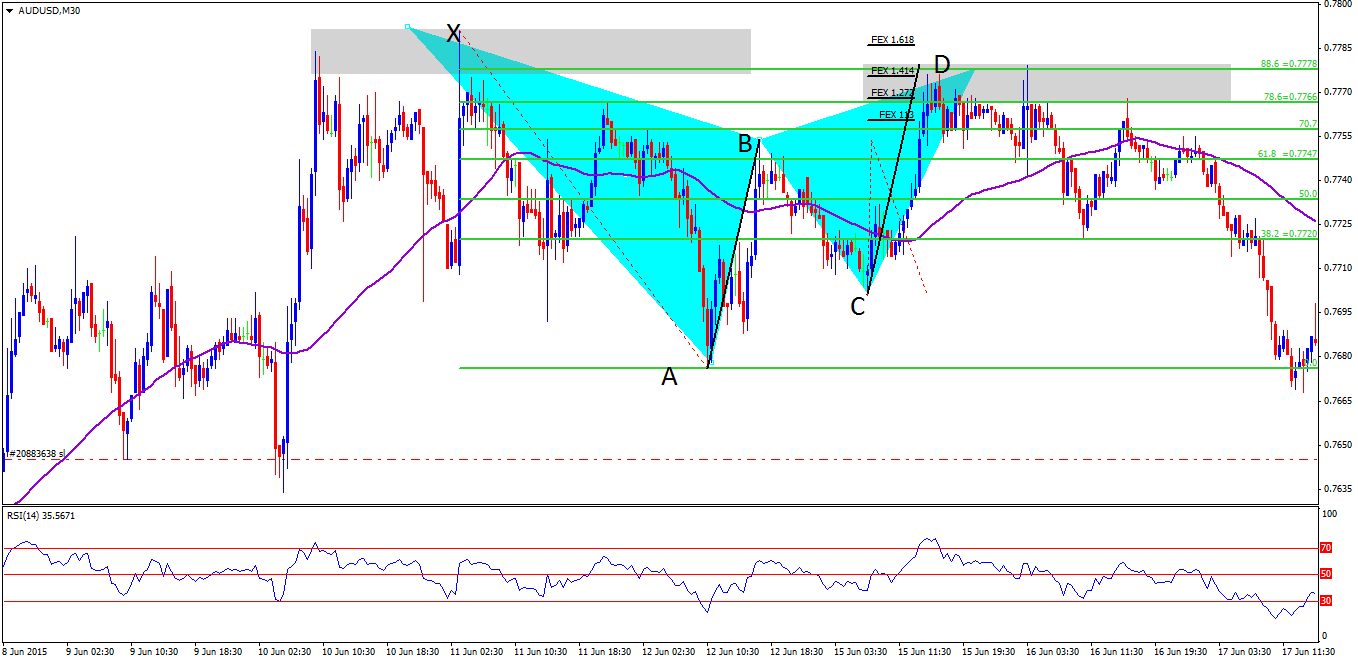
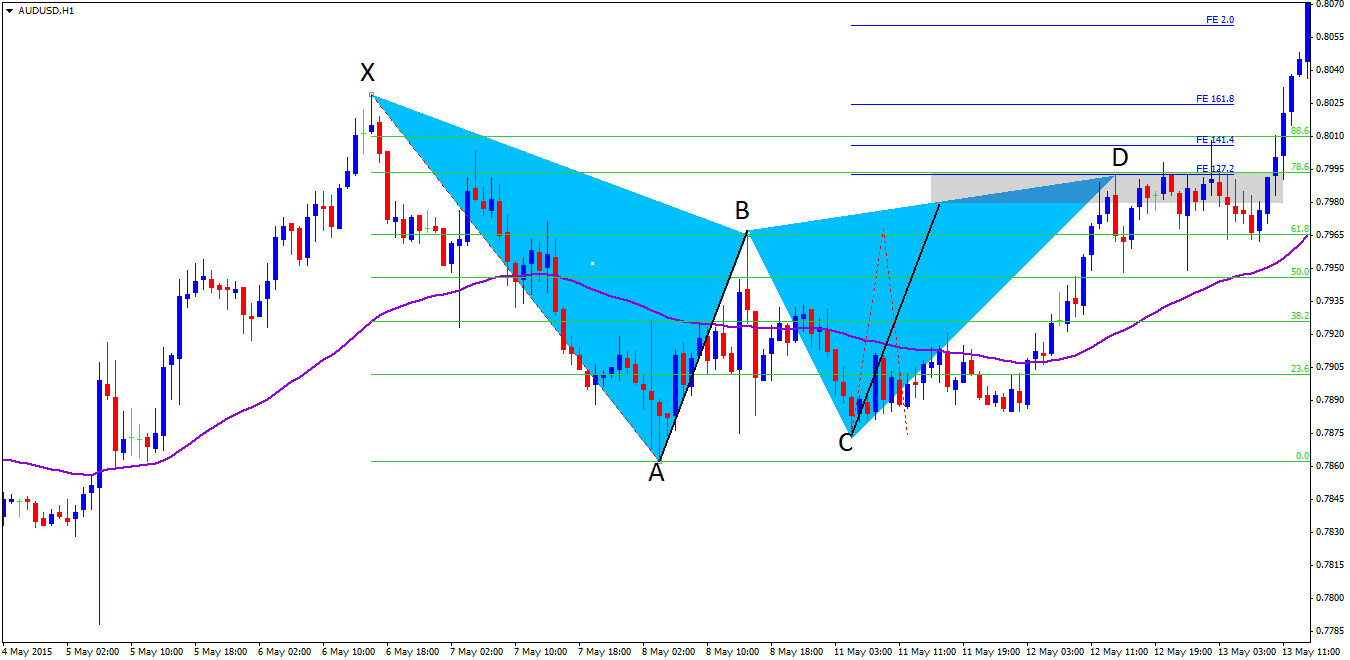
Examples: Figure 1 In the first example, point B is 99% right at 61.8% of XA. AB=CD, 1.272 BC projection and 0.786 XA define the PRZ. Price tests this area severely, which in a moment I thought I would be taken out of the trade. However, harmonic rules! The price is quickly rejected, creating a double bottom and rally. Figure 2 The second example shows a standard Gartley pattern. It is important to wait till all the PRZ has been tested. Patience and Decisiveness are keys in trading harmonic pattern. In the example, Price show a long blue candle right above the PRZ after falling dramatically. If trader lose his cool and buy, he will surely buy at the top. In the other hand, a patient trader will wait till the price comes in, tests the area then buy. AB=CD, 1.13 BC and 0.786 XA retracement form a very tight zone on the chart. The price gets rejected quickly after testing the PRZ. As usual, the PRZ only provide a temporary support.
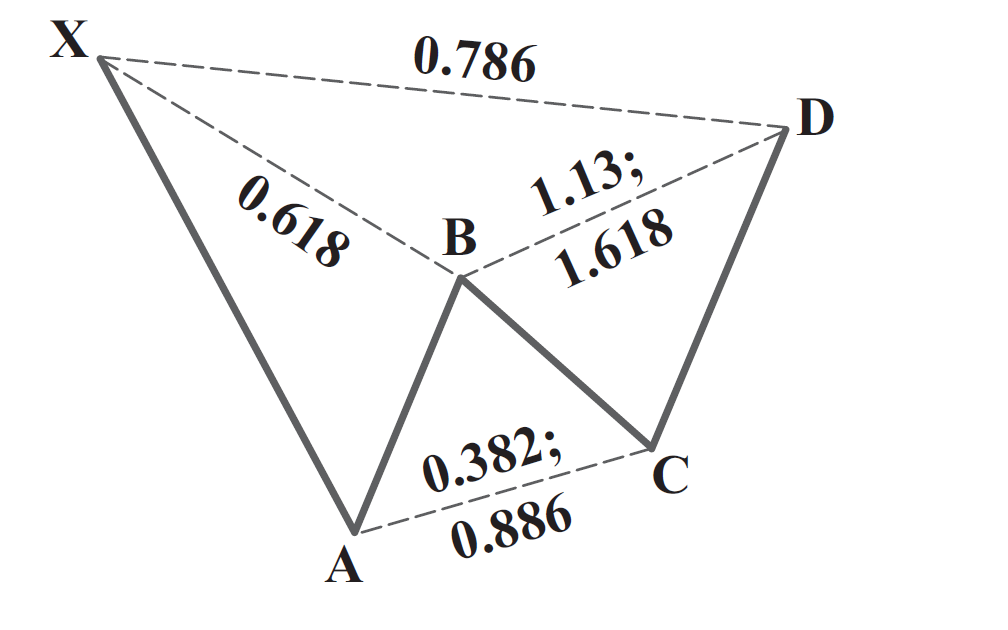
2. Bearish Gartley pattern
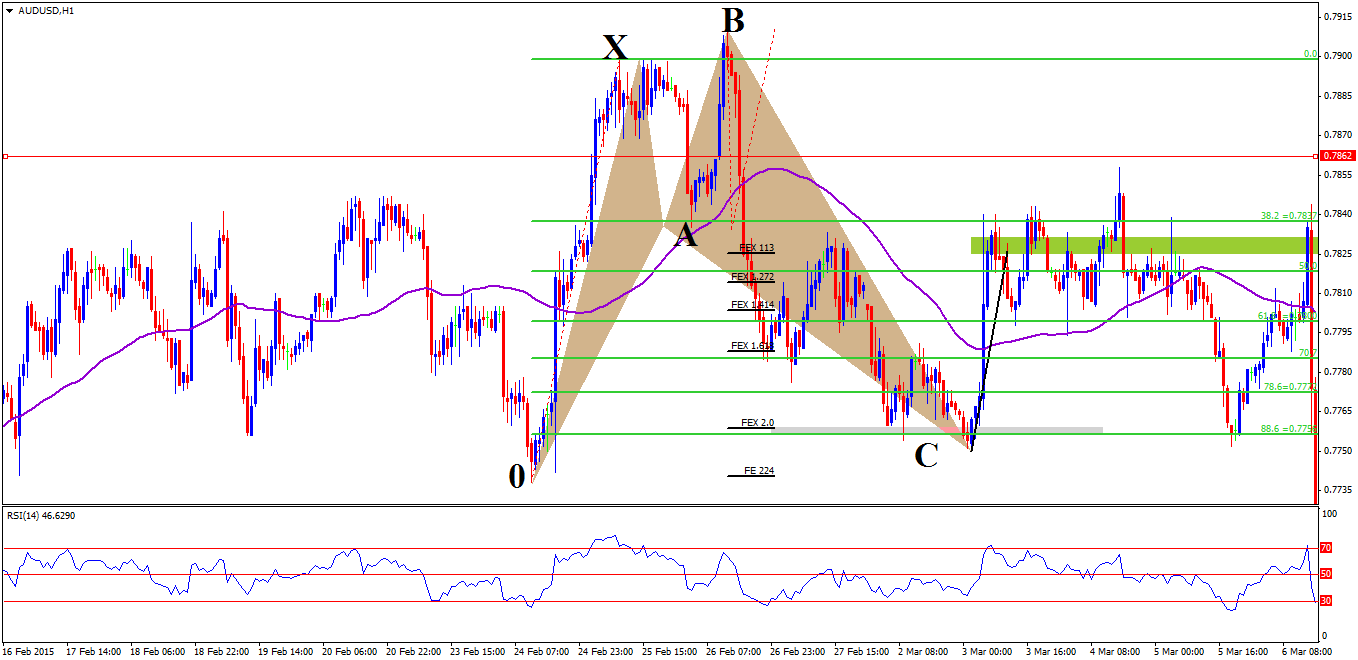
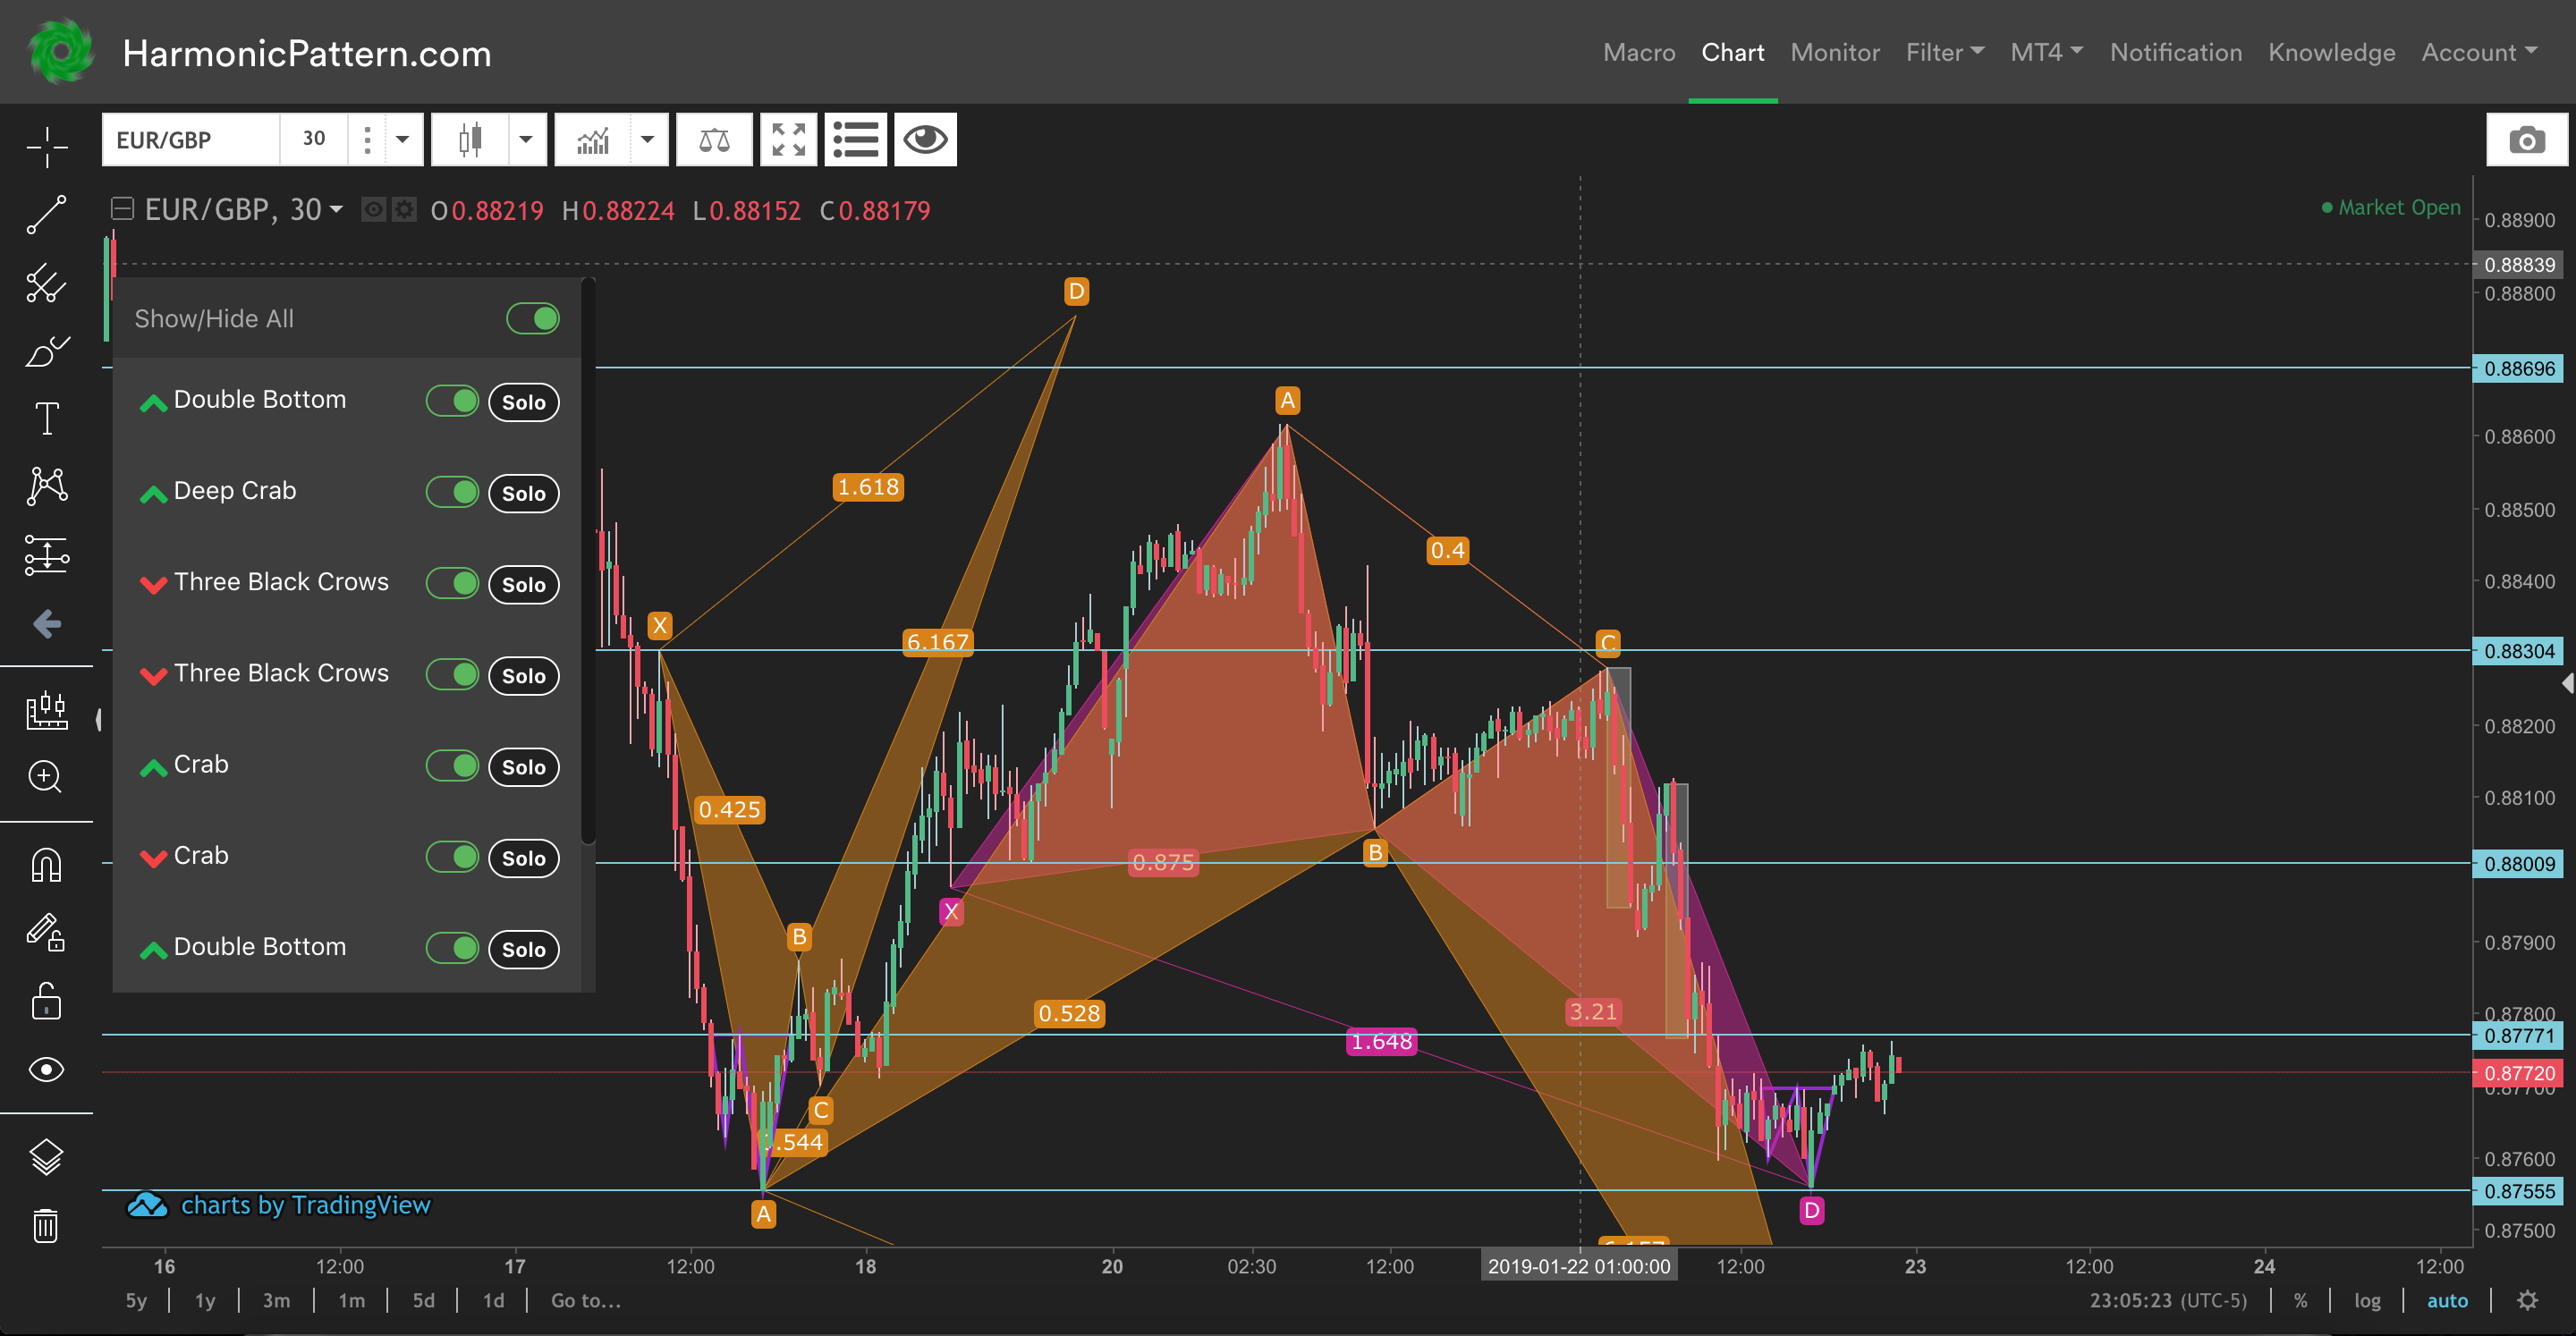
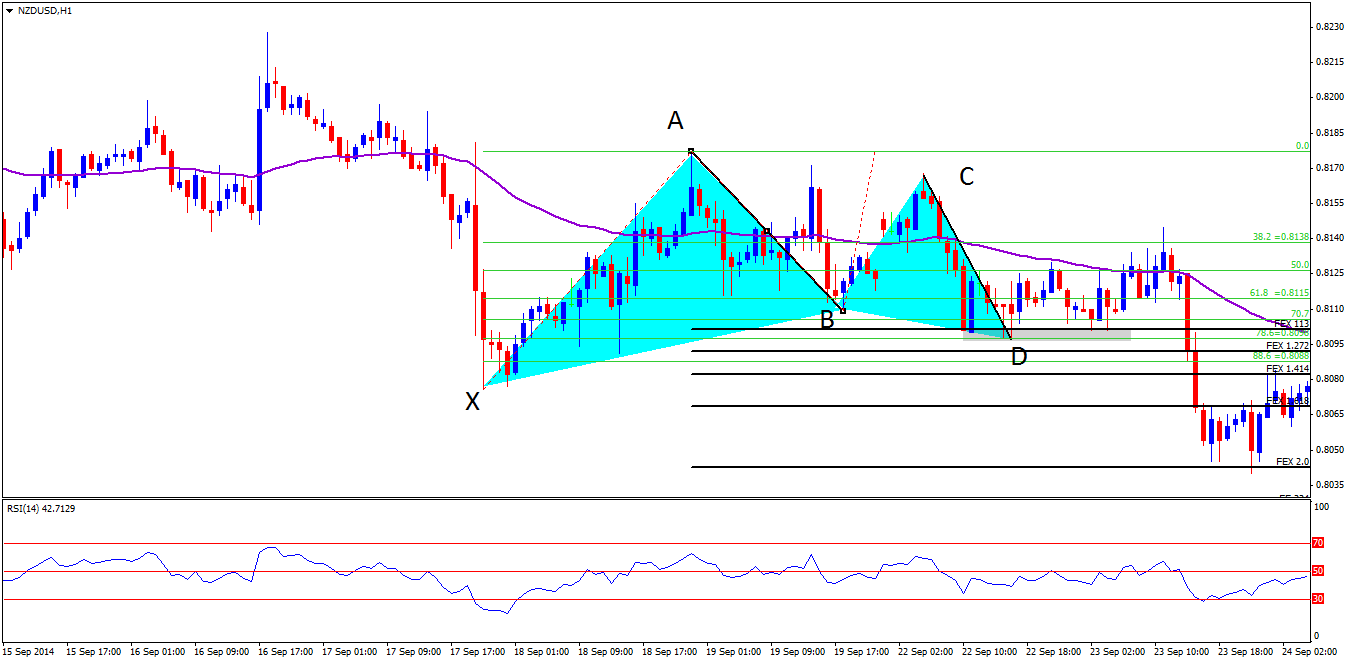
Examples: Figure 3 In figure 3, it is again very important to wait until the whole PRZ has been tested, especially the AB=CD level as it is the most critical element in the PRZ. AB=CD , 1.272BC and 0.786XA define the PRZ. Price tests the PRZ twice before giving up and “let the sky fall” begins :D Figure 4 Figure 4 illustrates a situation where the PRZ only provides a temporary resistance. Price tests this zone 3 times before the bull take over and price rally unstoppably. Although the Gartley can’t mark a reversal, AB=CD,1.272 BC and 0.786 XA creates a compact PRZ, which stops the rally for a while. And again, one of the most critical things to define a valid Gartley pattern is 61.8% retracement of point B. Gartley vs Bat: The difference between Bat and Gartley is the B point. We have different ratio alignment for B point in 2 patterns. Beside, if we mistake one pattern for another,let’s say we mistake the Gartley for the Bat, we might miss a trade as the price can reverse at 0.786 XA and doesn’t even test the 0.886 XA retracement. Experience and practice will tell you which pattern you are dealing with. If there are times when you can’t decide between Bat and Gartley, my advice would be stick with the Bat because it is safer when we can sell at higher price and buy at lower price compared to Gartley.
 Examples:
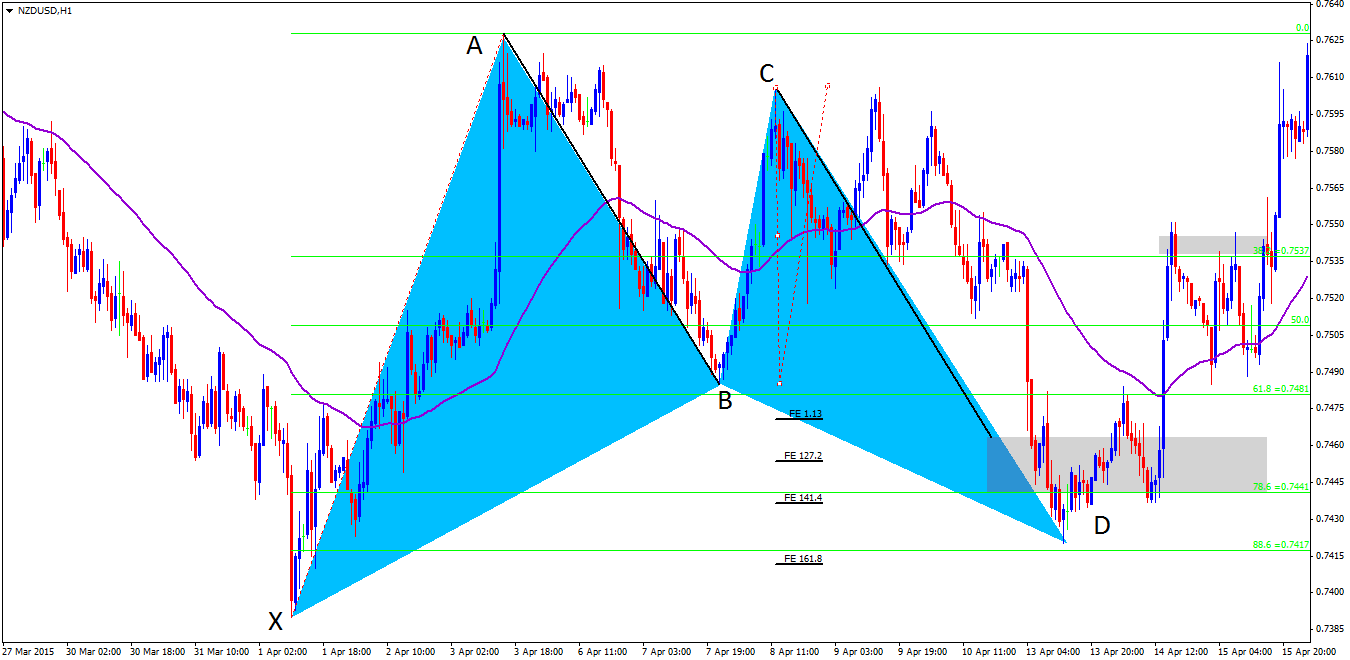
 Examples: