In this article, we will help you understand more about Technical Indicator signal and Trend signal in Chart tab.
1. Technical Indicator and Trend Signal
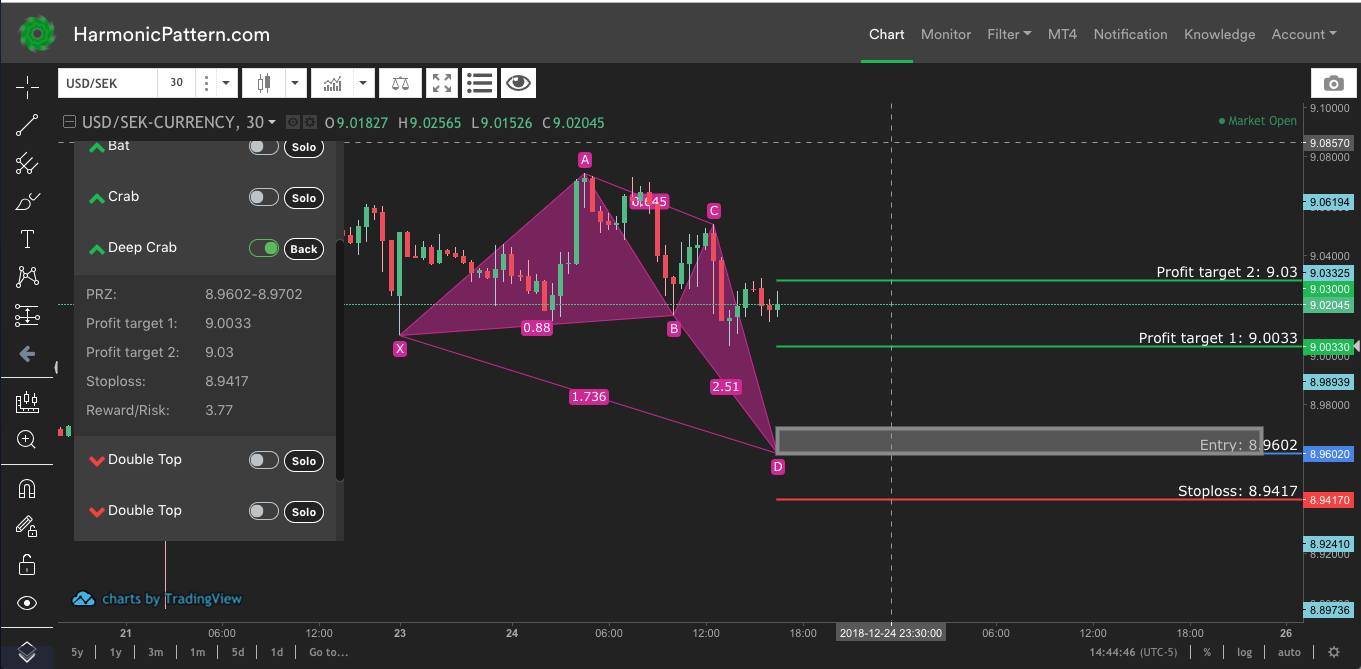
You can find Technical Indicator and Trend signal on the first 2 rows of the floating pattern list in Chart tab.
2. What do they mean ?
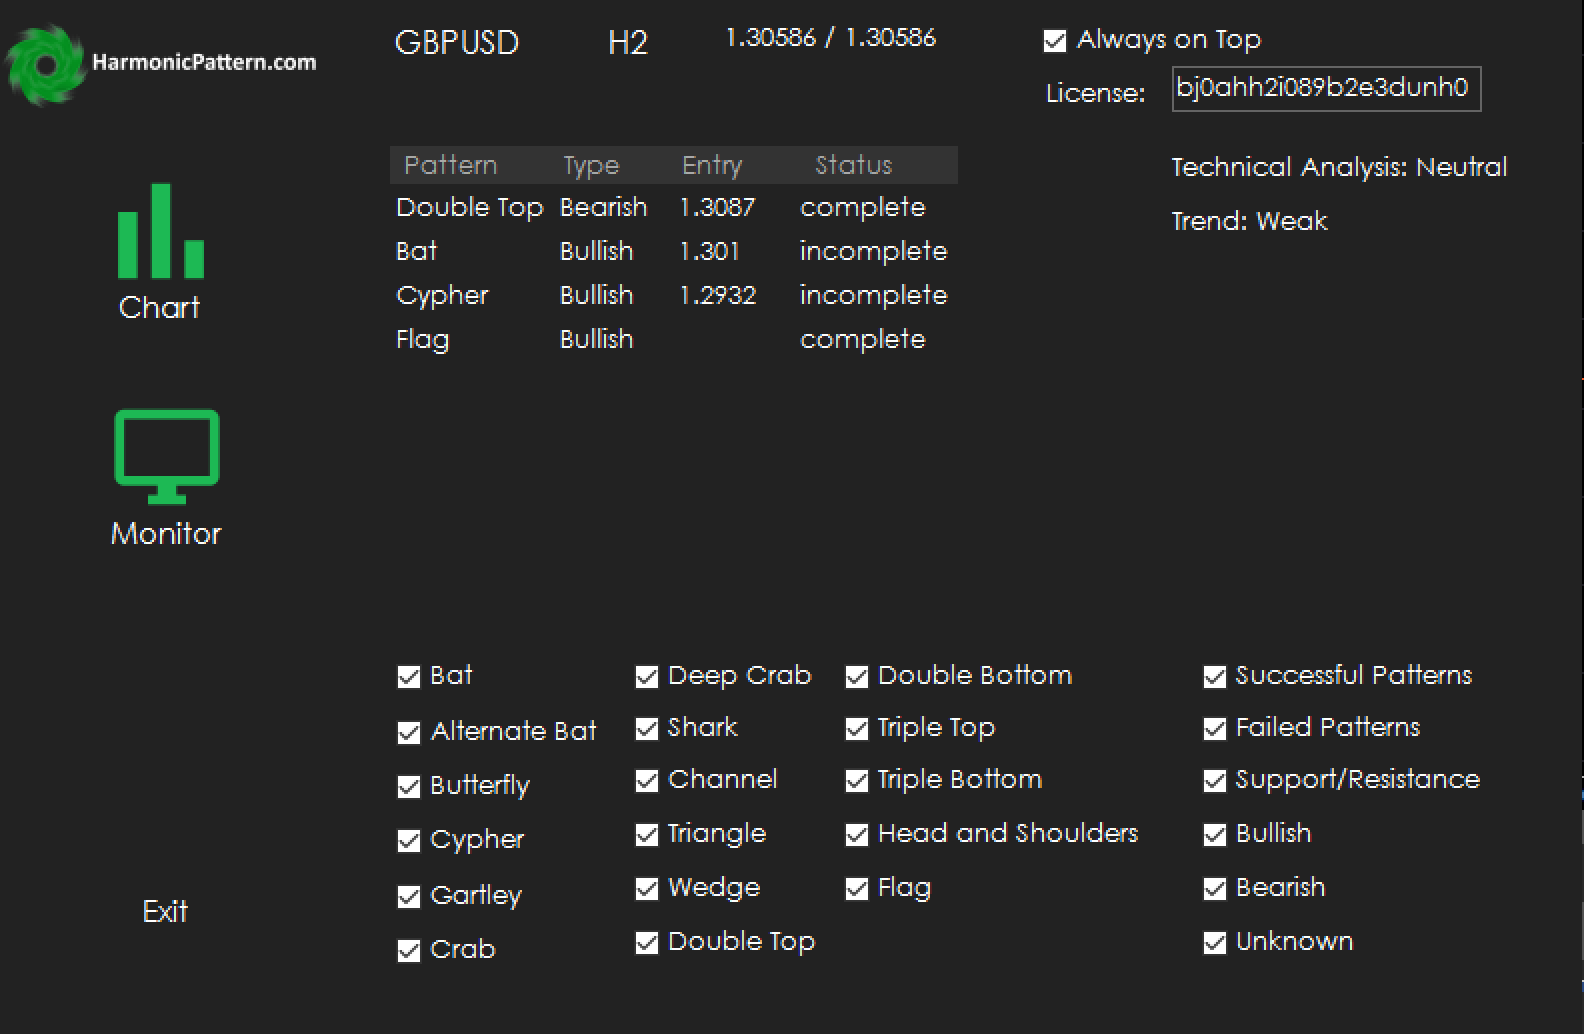
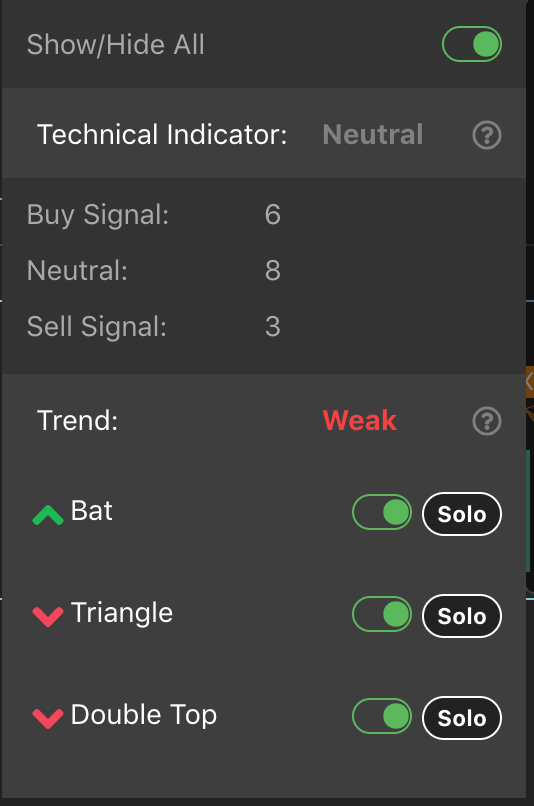
- Technical Indicator signal: It is the aggregate result of multiple Indicators such as Moving Average, RSI, MACD, Stochastic v.v. We use 18 indicators, at the time writing this article, to give you a picture about current technical bias in the market. Technical Indicator signal can have 5 values: STRONG SELL, SELL, NEUTRAL, BUY, STRONG BUY.
- Trend: It indicates whether the market is trending or moving in a sideway.
3. How to interpret these signals correctly and its usage?
- Technical Indicator Signal: Remember that indicator is just a formula with prices as the input. Hence, indicator only shows the CURRENT state of the market. So it's normal to trade a bearish harmonic pattern even when the Technical Indicator show STRONG BUY because the pattern can predict the reversal long before these indicators. That's the power of trading chart patterns. However, trading against a strong trending market is very dangerous and hence require proper risk management.
- Trend: If the market is trending, you can trade all kind of patterns. However, if the market is moving sideway, harmonic pattern works the best. Double Top/Bottom, Triple Top/Bottom, and Head & Shoulders are not a good choice in a WEAKLY trending market.
If you still have any questions, please reach out to us at: [email protected]