In this article, we will discuss a trading strategy that combines Harmonic patterns and Elliot wave theory ( Profit can be 1000 pips for a trade if done right).
The techniques used in this article are of advanced level so I would recommend any new traders to practice each technique (Harmonic pattern and Elliot wave theory) separately first before reading this article. Below are the resources where you can learn about these techniques:
Harmonic patterns:
+ Bat Pattern
+ Gartley Patern
+ Butterfly pattern
+ Cypher pattern
+ Crab pattern
+ Deep crap pattern
+ Shark pattern
+ Trade execution
+ Pattern failure
Elliot Wave theory :
I would recommend this book : http://www.amazon.com/Elliott-Wave-P.../dp/1616040491
Elliot wave will be a very hard technique to grasp but when you understand it, you will see its power.
Our Technique:
We will use the combination of Harmonic pattern and Elliot wave theory in this strategy. Below is the step:
1. We identify the Elliot wave count in the currency pair.
2. We spot wave 3 and 5.
3. We identify harmonic patterns that have a PRZ coinciding with the end of wave 3 or 5 or both and take the trades when the harmonic patterns complete.
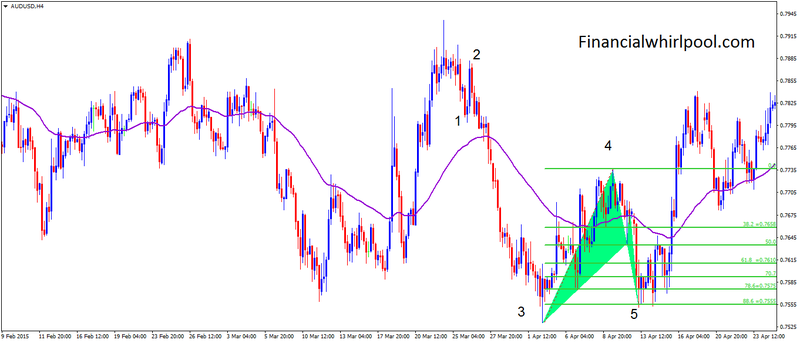
Example 1: Below is an example on AUD/USD H4 chart with 2 Butterfly patterns.
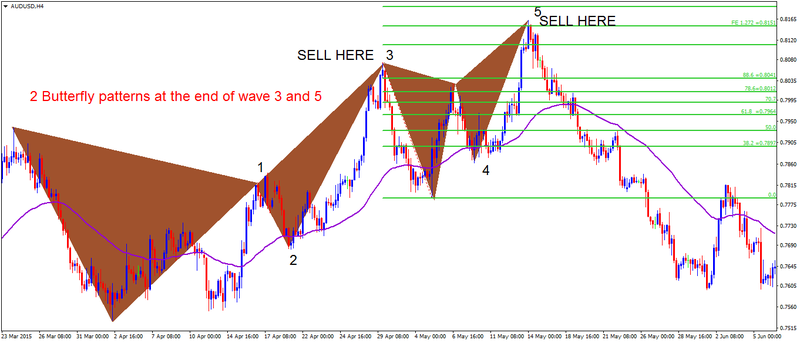
The harmonic pattern might only appear at the end of wave 5 but not wave 3 or vice versa. Luckily we have both in this case. When harmonic patterns show up at the end of wave 3 or 5, we have a perfect setup to go short. Especially at the end of wave 5, a trade can catch all wave A-B-C and profit hundreds of pips. Trade at the end of wave 3 will be a bit risky but sometimes it gives us a very nice reward. Of course, identify when wave 3 or 5 ends is extremely difficult. But with the help of harmonic patterns, it become possible and very profitable. With the help of harmonic pattern scanner, our job is now a lot easier.
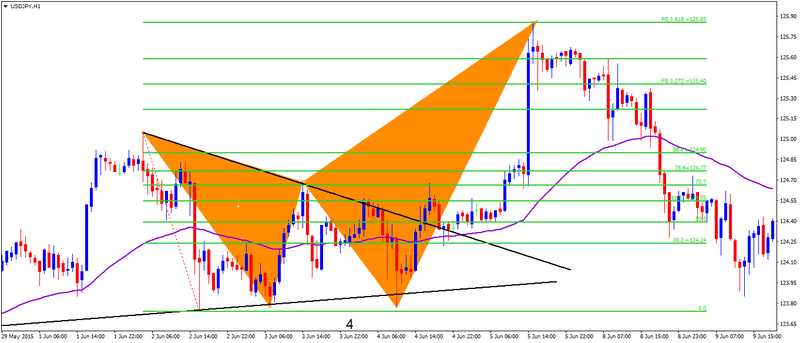
Example 2: As you might notice, this setup is extremely selective and profitable. We don't need to trade much to make profit. The less we trade, the less we subject to error and commission (spread). Below is one more example of this setup. We made 1000 pips selling wave 5 of USD/JPY with the Deep Crab pattern. The special thing about this wave count is that Wave 4 is a triangle and the PRZ of Deep crab pattern coincide with the target of that triangle. After the Non-farm came out strong for the US. It immediately reach the target. Despite the strong NF data, we went short this pair.
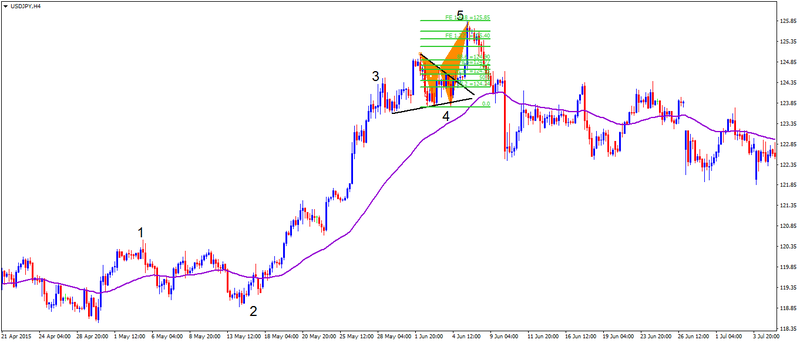
Zoom in the Deep Crab pattern:
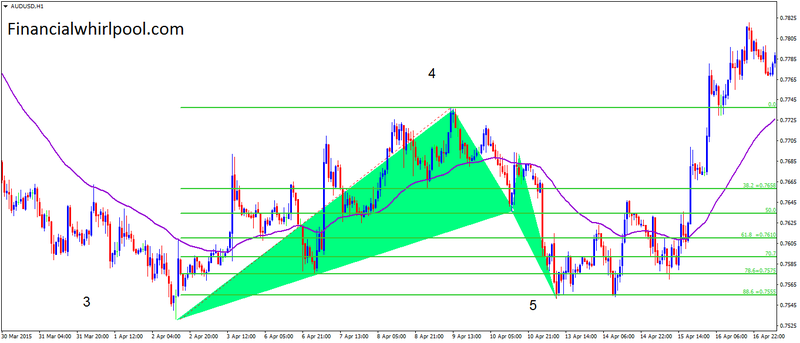
Example 3: This setup is a small but powerful one. AUD/USD with a BAT pattern. The special thing about this setup is that wave 5 is "truncated", which means it didn't pass wave 3. Normally we wouldn't expect it. But with a Bat pattern, it is possible now.
Zoom in Bat pattern:
We understand that the techniques used in this article is not easy to master. However, you can obviously spot the Fifth wave easier than the 3rd wave. The more the waves unfold, the easier you can spot it. The trick here is to identify a short wave 1, then followed by wave 2 retracement, which normally retrace more than half of wave 1. Then wave 3 is SUPER STRONG and you can spot it easily. Wave 4 is normally a triangle or flag following wave 3. Then wave 5 comes in and you have your chance. Remember the characteristics of each wave will help you identify wave 5 easily. The easiest thing to look at is wave 3 - very long and strong. From there, you can deduct others wave to trade
Happy trading!